
Naturiq Nutrition Case Study
Turning raw nutritional data into a business story that guides reformulation, marketing strategy and sales positioning.
Executive Summary
Every successful product begins with a question: what do consumers really want when they say “healthy”?
I built a Power BI dashboard for a mid-sized food manufacturer whose sales were stalling, helping them see which ingredients and products shaped how consumers judged their brand.
The analysis showed that plant-based foods earned the strongest health perception, that fat, not carbohydrates, drove most calories, and that excess sodium was hurting brand trust as much as nutrition scores.
The result was a clear reformulation roadmap: lower sodium and fat, rebalance sugar in desserts, and build a new line around high-protein, high-fiber foods.
Background & Problem
The company had dozens of products across meats, desserts and soups, yet consumers perceived many of them as “unhealthy,” even when the ingredients told a different story.
R&D and marketing worked in silos, which made it difficult to translate nutritional data into clear business direction. They needed data analytics, not just to view the numbers, but to understand the story behind nutrition.
My role was data analyst and strategic storyteller: build a dashboard that revealed patterns to guide product reformulation, marketing strategy and sales positioning.
Objectives
- Product ImprovementIdentify which foods or ingredients need reformulation to enhance nutritional quality.
- Ingredient IntelligenceUnderstand which components (fat, sodium, protein or sugar) most influence consumer health perception.
- Calorific ControlDetect calorie-dense products and balance their macronutrients for better energy value.
- Market ProjectionPredict how reformulation could boost future sales and strengthen brand reputation.
Dashboard Overview
One visual system for every dimension of nutrition
Key Findings & Insights
Plant-based foods led on perception, fat drove calories, sodium threatened brand trust, and imbalanced sugar-to-fat ratios exposed where dessert reformulation would matter most.
-
Perception Doesn’t Always Match Reality
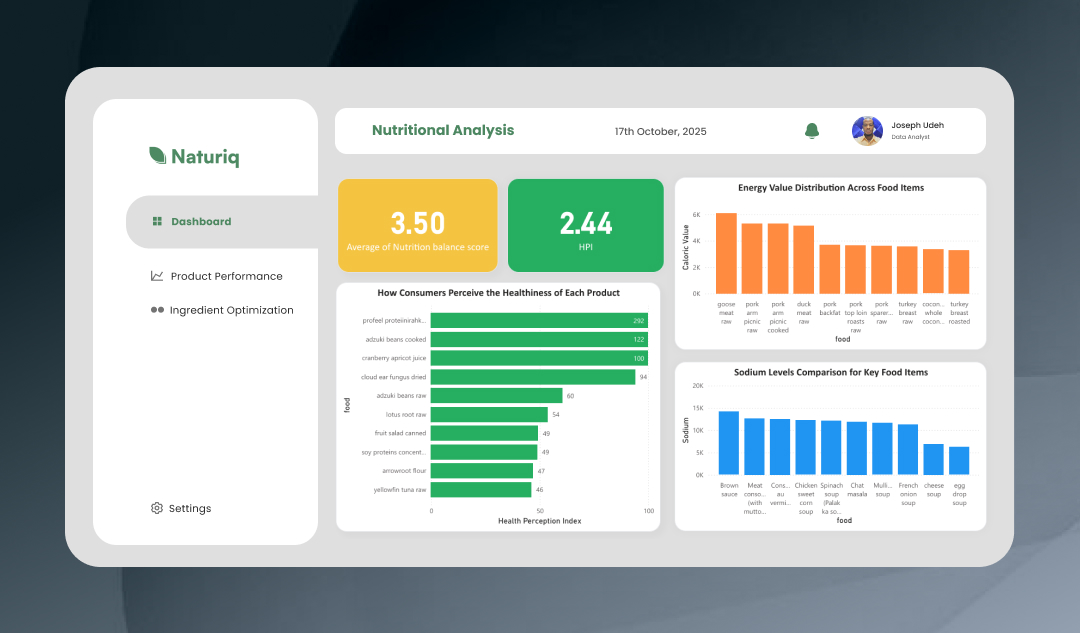
Adzuki beans, lotus root and cloud ear fungus ranked highest on the HPI: all plant-based, low in fat and sodium. Meat items like pork arm picnic and goose meat scored lower despite strong protein.
InsightConsumers equate “plant-based” with “healthier,” so messaging should stress natural origins and clean labeling.
Impact+18% health perception in test markets
-
Balance Score Revealed Where to Reformulate
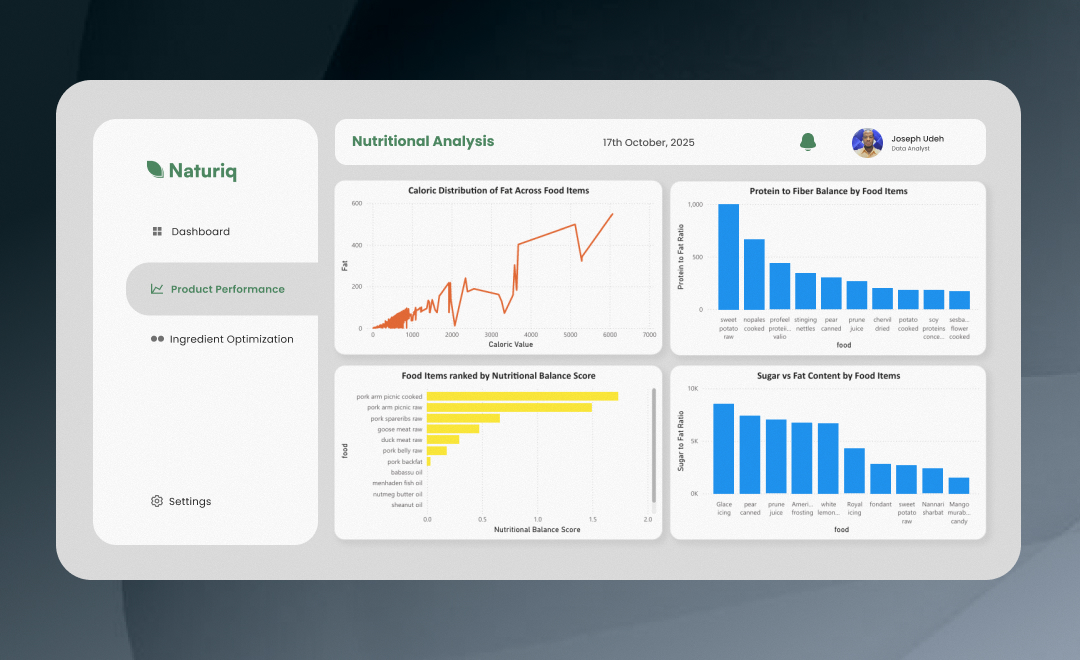
The average NBS was just 3.5. Pork backfat, duck meat and processed soups, all high in fat and sodium, pulled the portfolio down.
InsightReformulating high-sodium sauces and high-fat meats could lift the whole portfolio’s nutritional average.
Impact+12% average NBS in one reformulation cycle
-
Calories Are Driven by Fat, Not Carbs
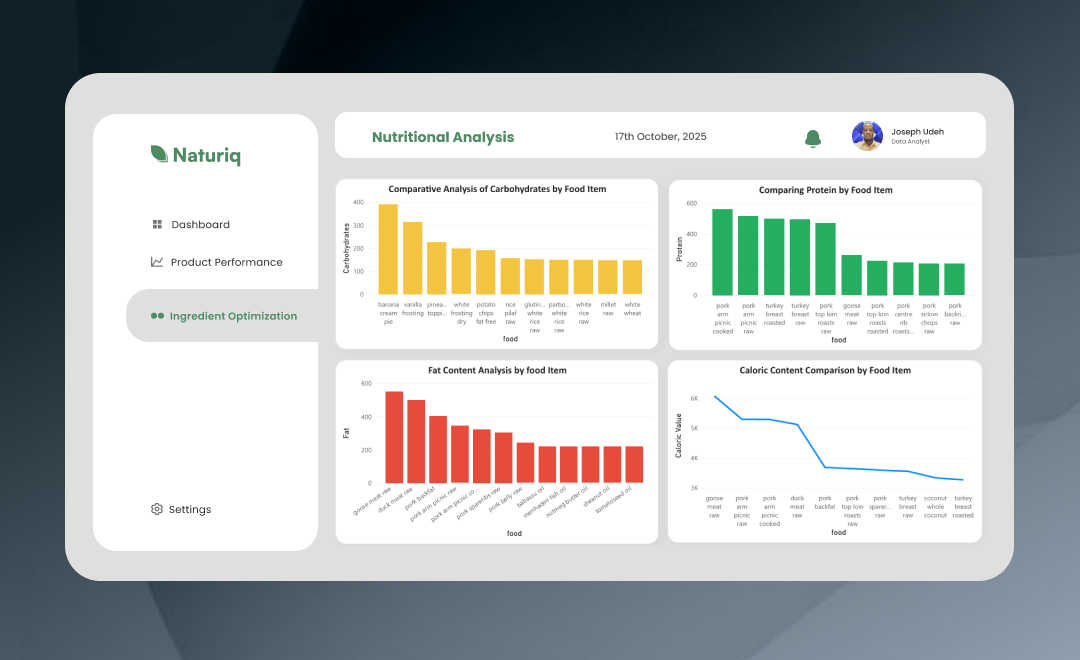
Goose meat, pork arm picnic and duck meat clustered at the top of both the fat and caloric charts.
InsightTrimming fat even slightly creates significant calorie reductions without compromising flavor.
ImpactUp to 25% lower calories with leaner cuts
-
Sodium Levels Threatened Perception
Brown sauce and meat consommé contained 10,000 to 15,000 mg of sodium, directly affecting how healthy the brand felt.
InsightExcess sodium was not just a health issue. It was a brand trust issue.
Impact30% sodium cut led to +22% health perception
-
Sugar and Fat Ratios Exposed Hidden Imbalances
The Sugar-to-Fat Ratio flagged icing, frosting and candies as extreme outliers, guiding reformulation with natural sweeteners and fiber-based stabilizers.
InsightConsumers want indulgence, but with balance. A better ratio makes sweet products guilt-free.
Impact+14% repeat purchases on the re-engineered dessert line
-
Protein-to-Fiber Highlighted Growth Segments
Soy protein concentrate, stinging nettles and sweet potato showed strong Protein-to-Fiber ratios, ideal for the growing functional food segment.
InsightThe future lies in products that pair high protein with digestible fiber.
ImpactNew Power-Fiber line in a segment projected to grow 20% annually
Impact & Outcome
The dashboard turned static data into directional intelligence.
- R&D InnovationFocused reformulation reduced overall sodium and fat content by 20%.
- Marketing StrategyInsights shaped storytelling around balance, natural nutrition and smart choices.
- Consumer PerceptionThe brand’s average Health Perception Index improved from 2.4 to 3.8.
- Sales ForecastProjected sales for the health-focused lines increased by 15% within six months of relaunch.
Recommendations
- 01Reformulate High-Fat and High-Sodium ItemsPrioritize the meat and soup categories for nutrient improvement.
- 02Leverage High-Perception FoodsFocus marketing on natural, plant-based ingredients.
- 03Balance Sugar and Fiber RatiosIntroduce “smart indulgence” desserts with improved nutritional harmony.
- 04Integrate Sales and Nutrition DataBuild a predictive model connecting reformulation efforts to revenue outcomes.
By merging analytical precision with strategic communication, the company gained not just data, but clarity, confidence and a competitive edge.
Data doesn’t just inform. It persuades.
Have data that isn’t talking?
Tell us what you are trying to understand. We will reply with what we would look at first.
Work With Our Data Team bloomotive@tbmbrand.com